Engine-overhaul project management and 3D visualization
A project-management tool that lets an engine-overhaul company's clients see live progress on their engines. The company records the progress, and each client sees only their own work orders, drawn on the engine itself.
- Problem
- An engine overhaul involves many tasks whose order depends on one another and on what has to come off first. Planners need to see what can start and what drives the finish date, and clients want to know where their engine stands without waiting for a status report.
- Intended users
- The company's managers, who record and track the work, and its clients, who see their own engines.
- My contribution
- I designed and built the scheduler, the progress and client views, the engine data and the 3D teardown viewer.
- Engineering decisions
- The engine data comes from manufacturer manuals, so parts, teardown order and prerequisites match established procedures instead of being guessed. Scheduling dependencies and teardown prerequisites are separate models, because they answer different questions.
- Evidence
- A demo work order shown at two dates, the scheduling tests, a check against real project schedules and the client views.
- Status and scope
- Clients sign in to their own accounts and see progress as the company records it. The pictures on this page use made-up demo data. The 3D model is a visualization aid and doesn't replace maintenance documentation.
One workflow: removal tasks complete
This follows one made-up work order, DEMO-1002, through four working days of its teardown. The two frames are the same work order drawn for two dates.
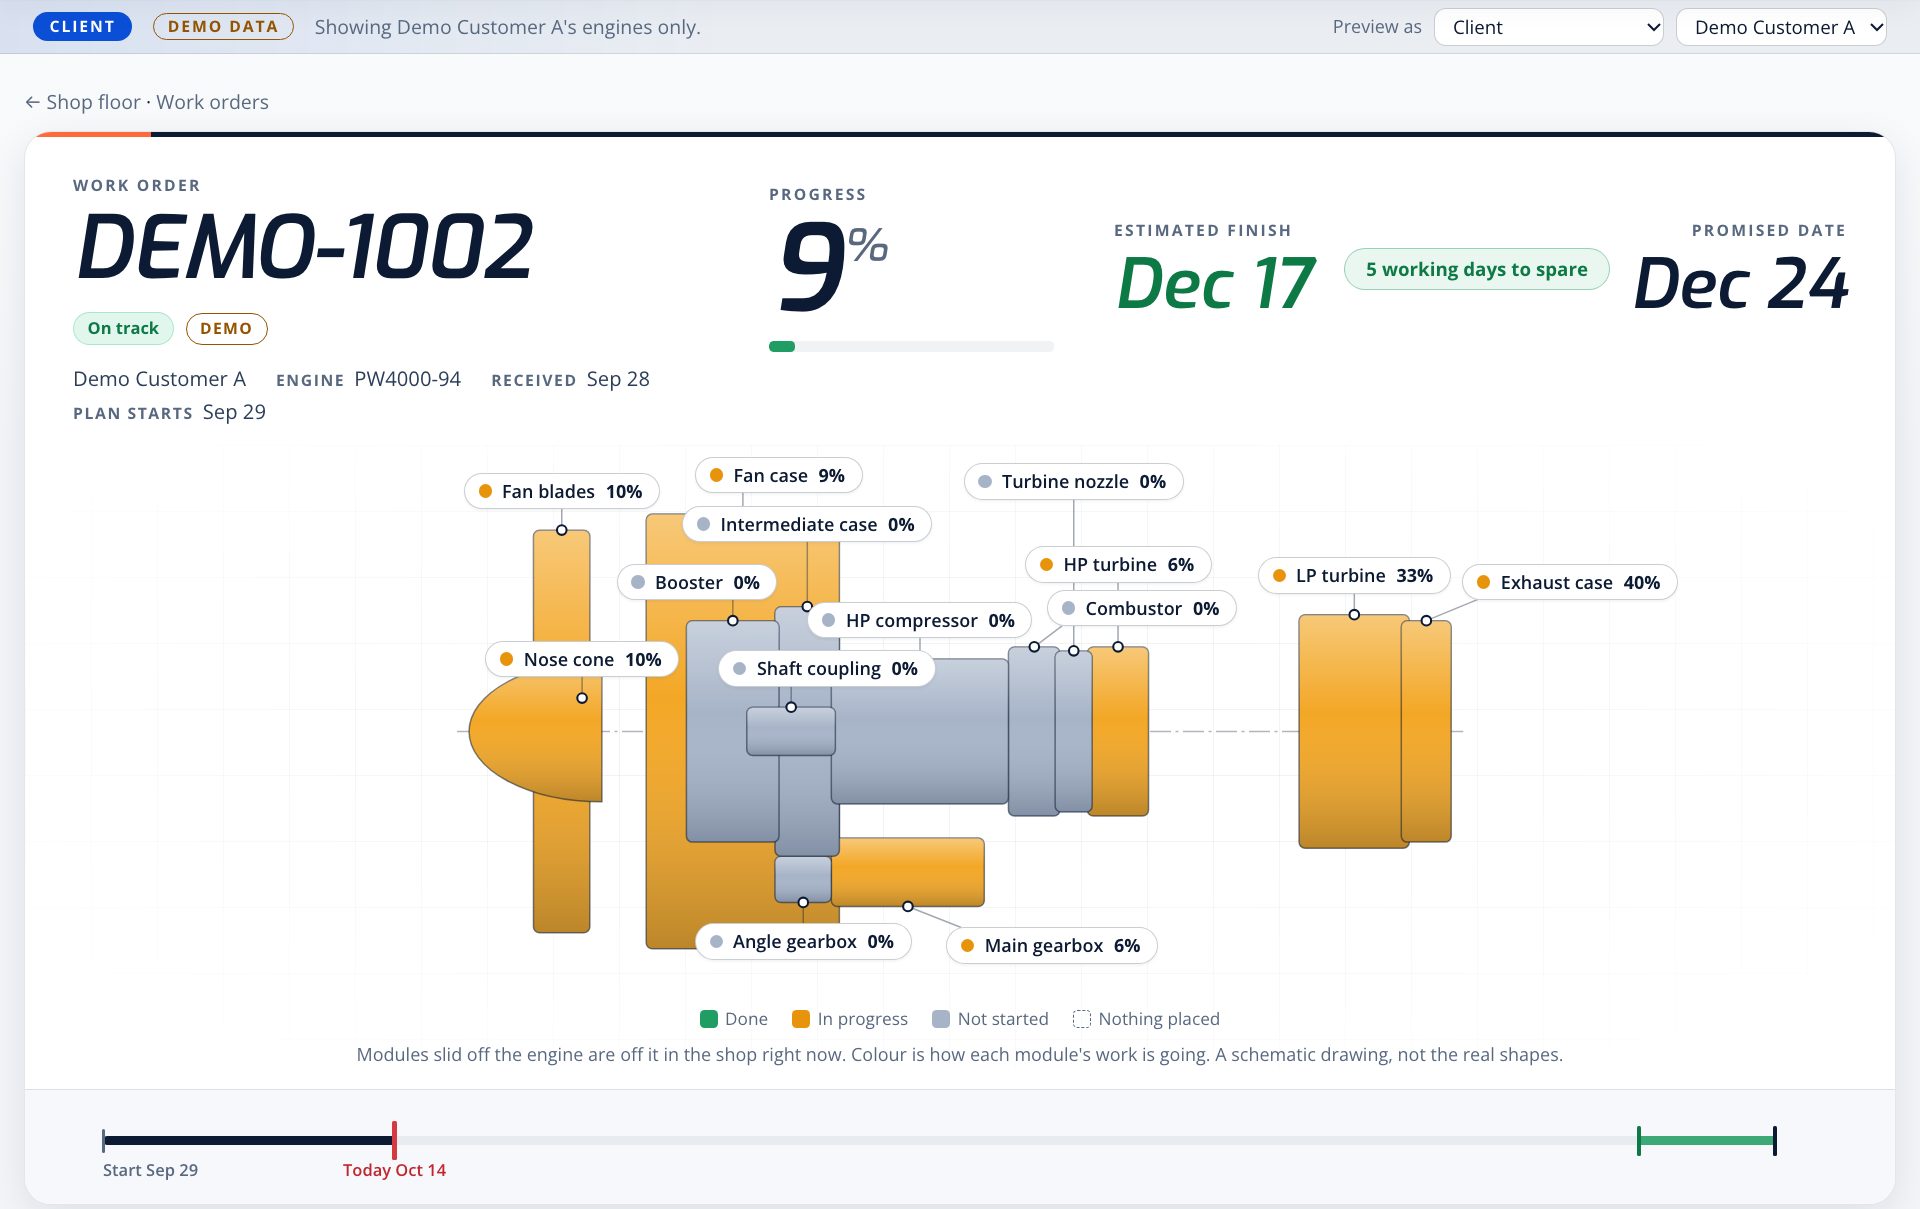
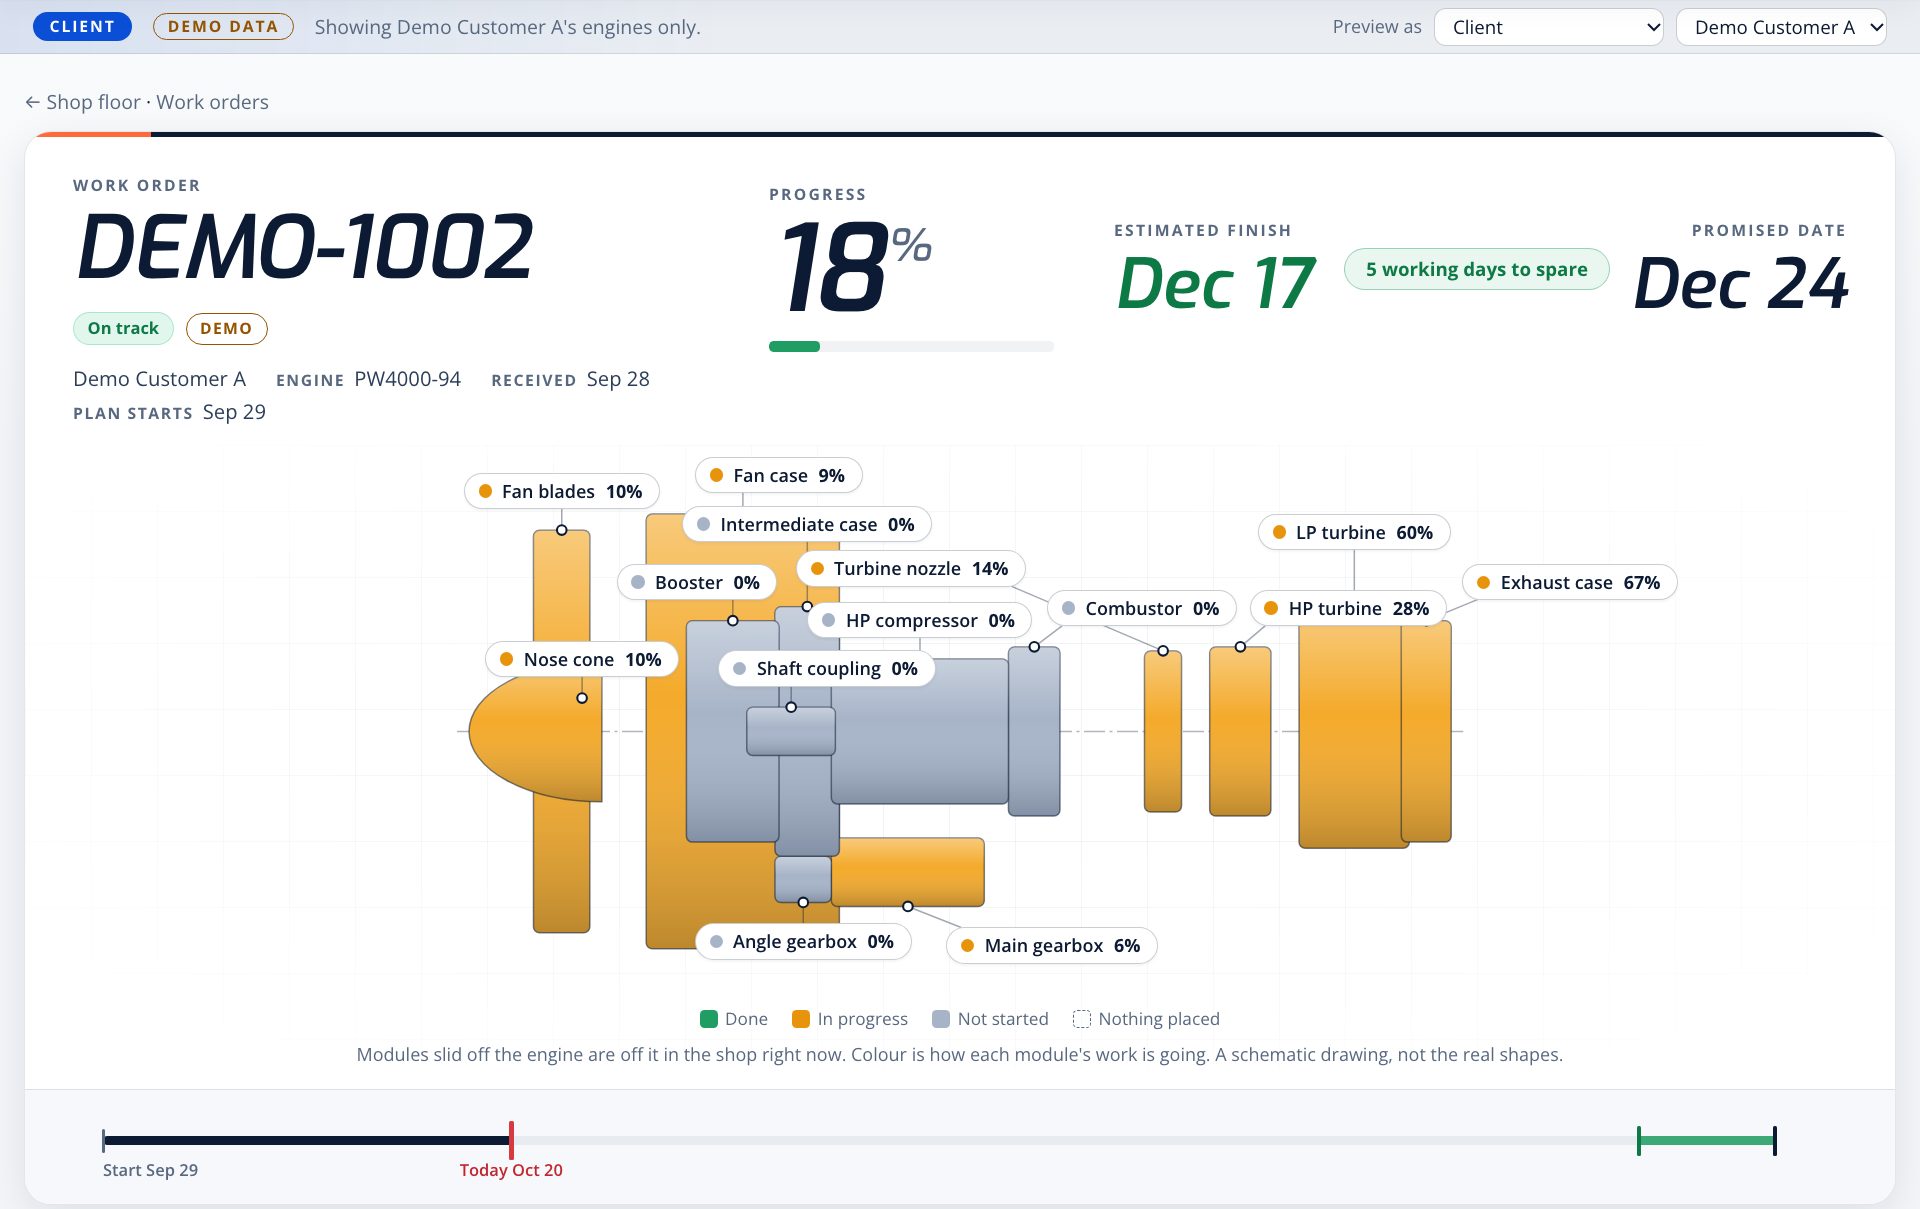
- Tasks complete. The removal tasks scheduled for those days are marked done.
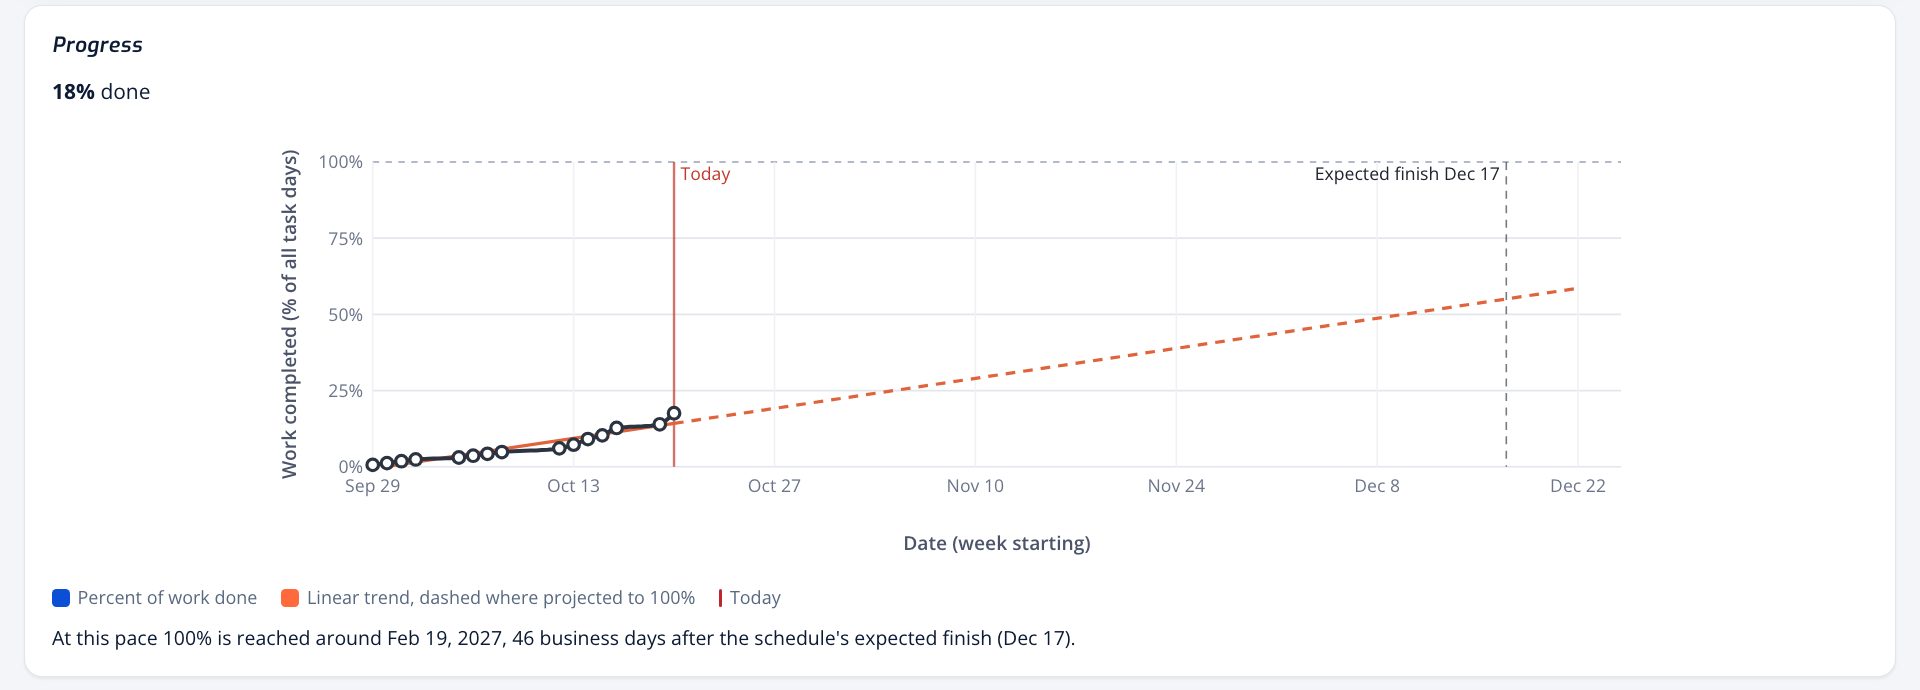
- Schedule and progress update. Progress is weighted by task duration, so it rises from 9% to 18%. The work is on plan, so the forecast stays at December 17.
- The assembly view follows. Each module's percent and color update, and modules whose removal is done slide off the drawing.
The 3D model and drawings are visualization aids and don't replace maintenance documentation.
How the dependency logic works
Tasks are linked by finish-to-start dependencies, each with an optional lag, and a forward and backward pass gives each task its dates and slack. Teardown prerequisites are a separate model.
A worked example from the scheduler tests
Tasks with zero slack form the critical path. This example comes from the project's scheduler tests, which use made-up task names:
| Task | Length | Waits for | Dates | Slack |
|---|---|---|---|---|
| A | 2 days | None | Mon Oct 26 to Tue Oct 27 | 0, critical |
| B | 3 days | A | Wed Oct 28 to Fri Oct 30 | 0, critical |
| C | 1 day | A | Wed Oct 28 | 2 days |
| D | Milestone | B and C | Fri Oct 30 | 0, critical |
A related test forecasts from actual progress. On Thursday, with A finished, B half done and C not started, C moves to Thursday and B is expected to finish Friday. Finished work keeps its actual dates, and nothing unfinished stays in the past.
| Scheduling dependency | Teardown prerequisite | |
|---|---|---|
| Question | When can this task start? | What has to come off before this part can be reached? |
| Link | Task to task, finish-to-start with optional lag | Part of the assembly to what must be removed first |
| Result | Dates, slack and the critical path | An ordered removal path; reinstalling is that path backwards |
| Test checks | Dates, slack, lag, weekends, and an error instead of a hang on a loop | Every prerequisite comes first, no step repeats, and an unknown part returns “unknown” instead of a guess |
Built from the manuals
The engine data is built from Pratt & Whitney and GE manuals and the company's workscopes, so the relationships in the tool match established procedures.
- Parts. The PW4000-94 data holds 14 modules, 182 parts and assemblies and 339 part numbers, cross-checked against the manufacturer's Illustrated Parts Catalog and shop records.
- Disassembly and assembly. A 21-step engine teardown follows the prerequisites in the Engine Manual, and tests fail if a step comes before something it depends on. Assembly runs the same relationships in reverse.
- Relationships. The removal graph links 73 parts of the assembly with 84 prerequisites, none of them assumed, so the tool can answer what has to come off to reach any part.
- 3D model. With no CAD available, the 3D engine is generated in code from the manuals' cross-sections and schematics. Module positions and key proportions follow those figures, and the rest is drawn to match. It's for visualization, not measurement.
What a client sees
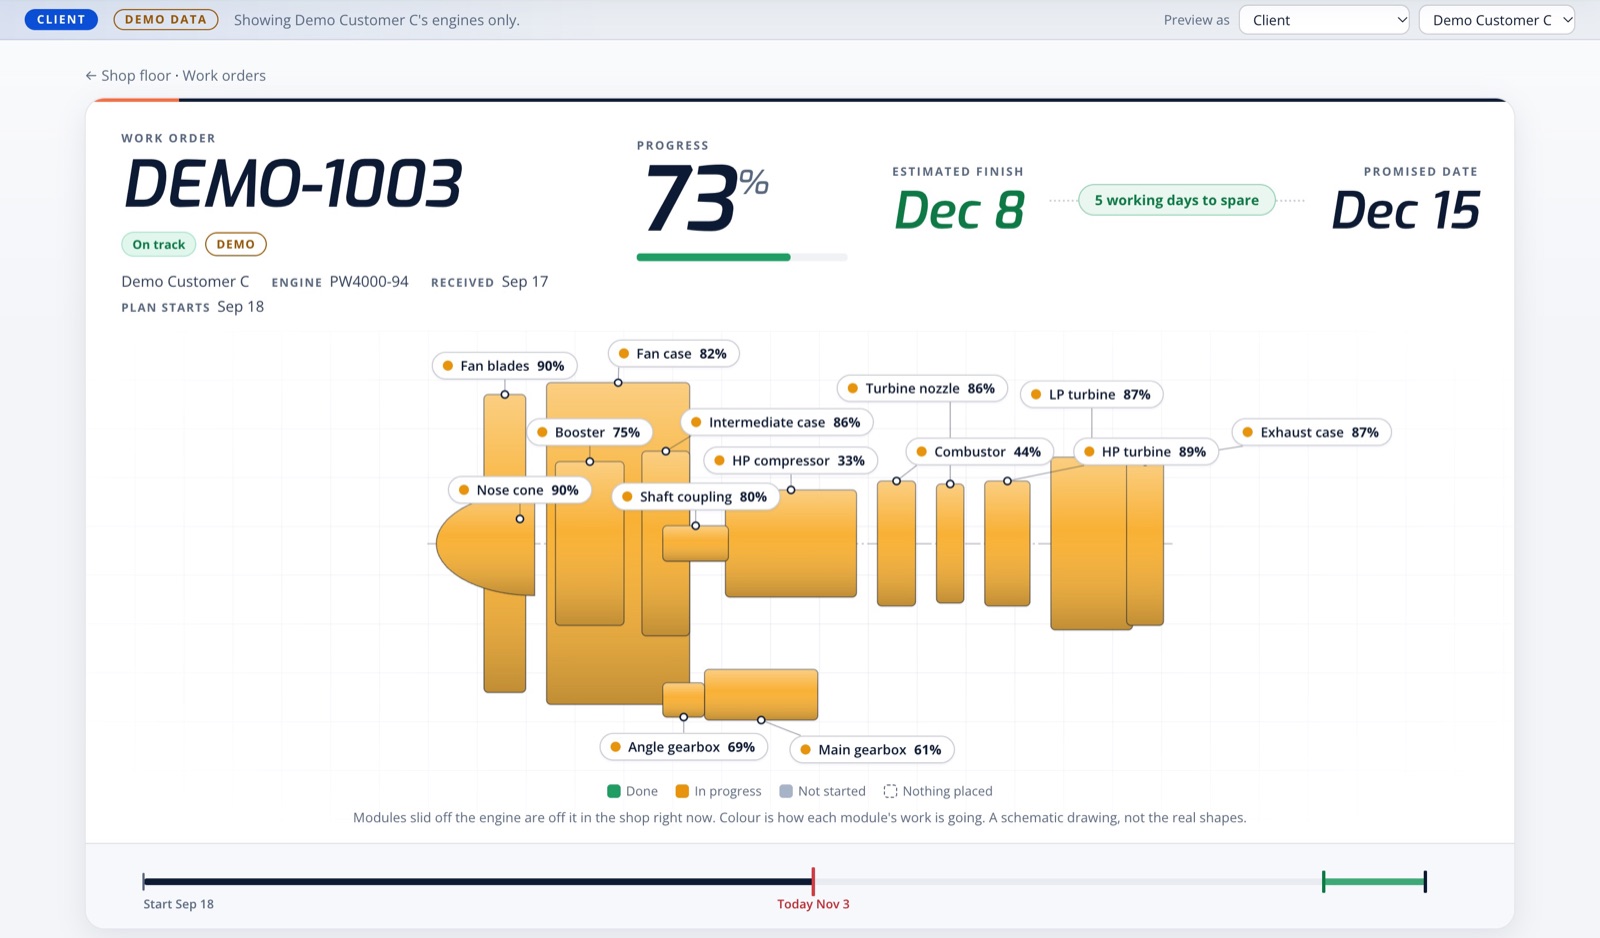
Each work order opens on the engine itself, drawn module by module. Color shows how each module's work is going, and a module that has been slid off the drawing is off the engine in the shop. Next to it are the three things a client asks first: how far along the job is, when it should finish, and how that compares with the promised date.
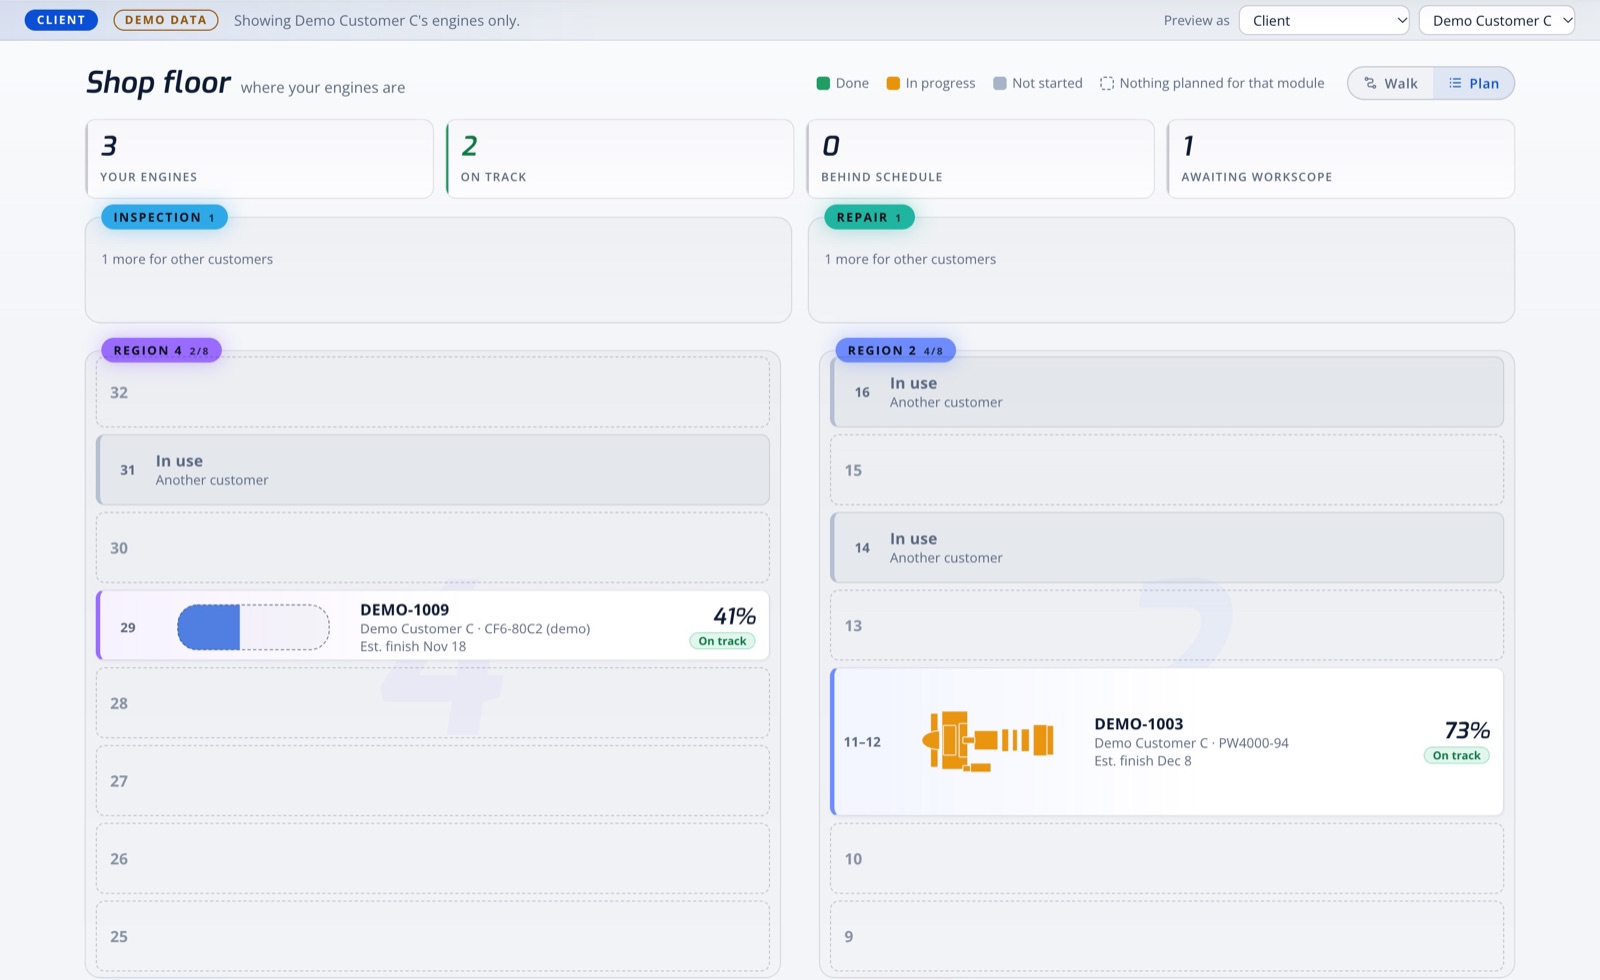
The front page is the shop floor seen from above, laid out from the company's production layout sheet. Every engine sits in its bay in the state its work is in, with animated figures at the modules where work is under way. A client's view shows the details of their own engines only.
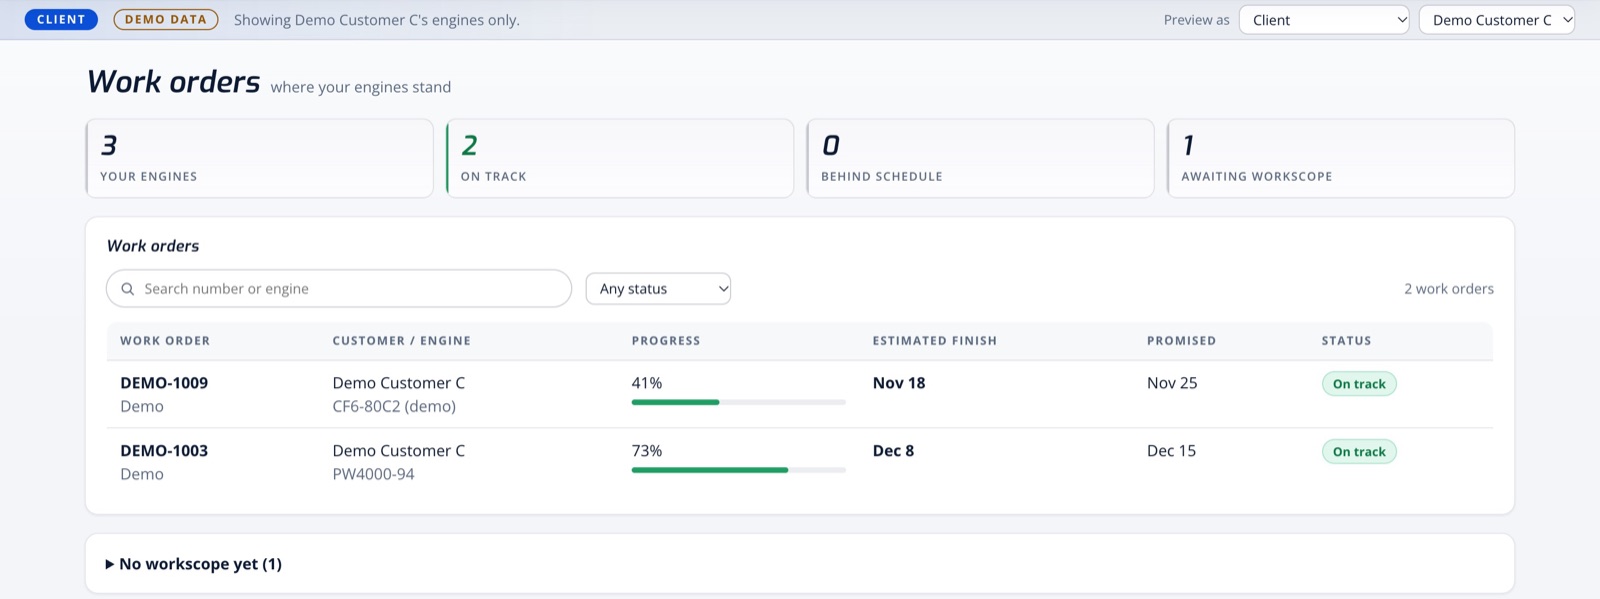
Teardown visualization
An interactive Three.js model lets you open an engine module by module, down to individual parts, and step through a teardown sequence. On a work order, a time cursor on the schedule redraws the engine on any day of the job, from actual dates in the past and the forecast ahead. The viewer is for the company's staff, and it isn't pictured here because it carries manual data.
Status
| Status | What it covers |
|---|---|
| Working | Per-client sign-in, live progress recorded by the company, scheduling and forecast logic, the progress chart and Gantt views, client and management views, the animated shop floor and the 3D teardown viewer. The scheduling, teardown and view logic is covered by more than 500 automated tests. |
| Checked on real schedules | Imported from two real project schedules, the tool reproduced 254 of 254 and 284 of 284 printed dates and both project finishes. |
| Shown here | Every work order, customer, date and progress value on this page is made-up demo data. |
Implementation
- The scheduling and progress logic is TypeScript, ported from my earlier JavaScript scheduler on PostgreSQL and Supabase, which follows Microsoft Project's date rules.
- The 3D viewer is TypeScript and Three.js, with automated tests for its sequencing logic.
- The software isn't publicly available.