Wind-aware scheduling for data center chillers
Air-cooled chillers reject a data center's heat outdoors, and wind can carry that hot air into a neighboring unit's intake. For our capstone with Trane Technologies, my team tested the plume in a wind tunnel and built a model that recommends which chillers to run.
- Problem
- Meet the cooling demand and reduce power when wind carries one chiller's exhaust into another's intake, while keeping runtime balanced across the fleet.
- My contribution
- I ran the Ansys airflow analysis that sized the first rig, led its failed tests, proposed the revised smoke source and inline layout, helped define the revised dimensions, and laser-cut and assembled parts. I coordinated the tunnel testing and collected the images and air-temperature profiles. I shared the plume and COP research, derivations, Python studies and scheduling work with teammates.
- Engineering decisions
- Replacing candles with the lab's smoke generator gave a plume the cameras could resolve. Moving three outlets into one row let a side-on camera see the source and the downstream path.
- Evidence
- Rig CAD, an Ansys airflow result, smoke and FLIR images of the plume, the model equations and the dashboard's simulation output.
- Outcome
- The revised rig produced usable visible and thermal plume records. Separately, the scheduling model predicted lower energy use in one simulated scenario. We delivered a report and a software demonstration to Trane.
- Scope
- The rig is a small smoke and thermal surrogate and did not measure chiller energy. The energy figure comes from one simulation and is not a measured saving.
- 14.8% lower simulated energy use
- In one illustrative 24-hour scenario for a 3 × 5 chiller array, compared with running every unit continuously. The energy comparison is a simulation result, not a measured reduction from an operating data center.
The problem
A chiller's efficiency depends on the temperature of the air it pulls in. Downwind units breathe warmer air, so they need more power to deliver the same cooling. High-fidelity CFD can show this effect, but it is too slow to run every time the wind shifts, so the goal was a fast Python model an operator could use and understand.
Why the first apparatus changed
- Intended measurement
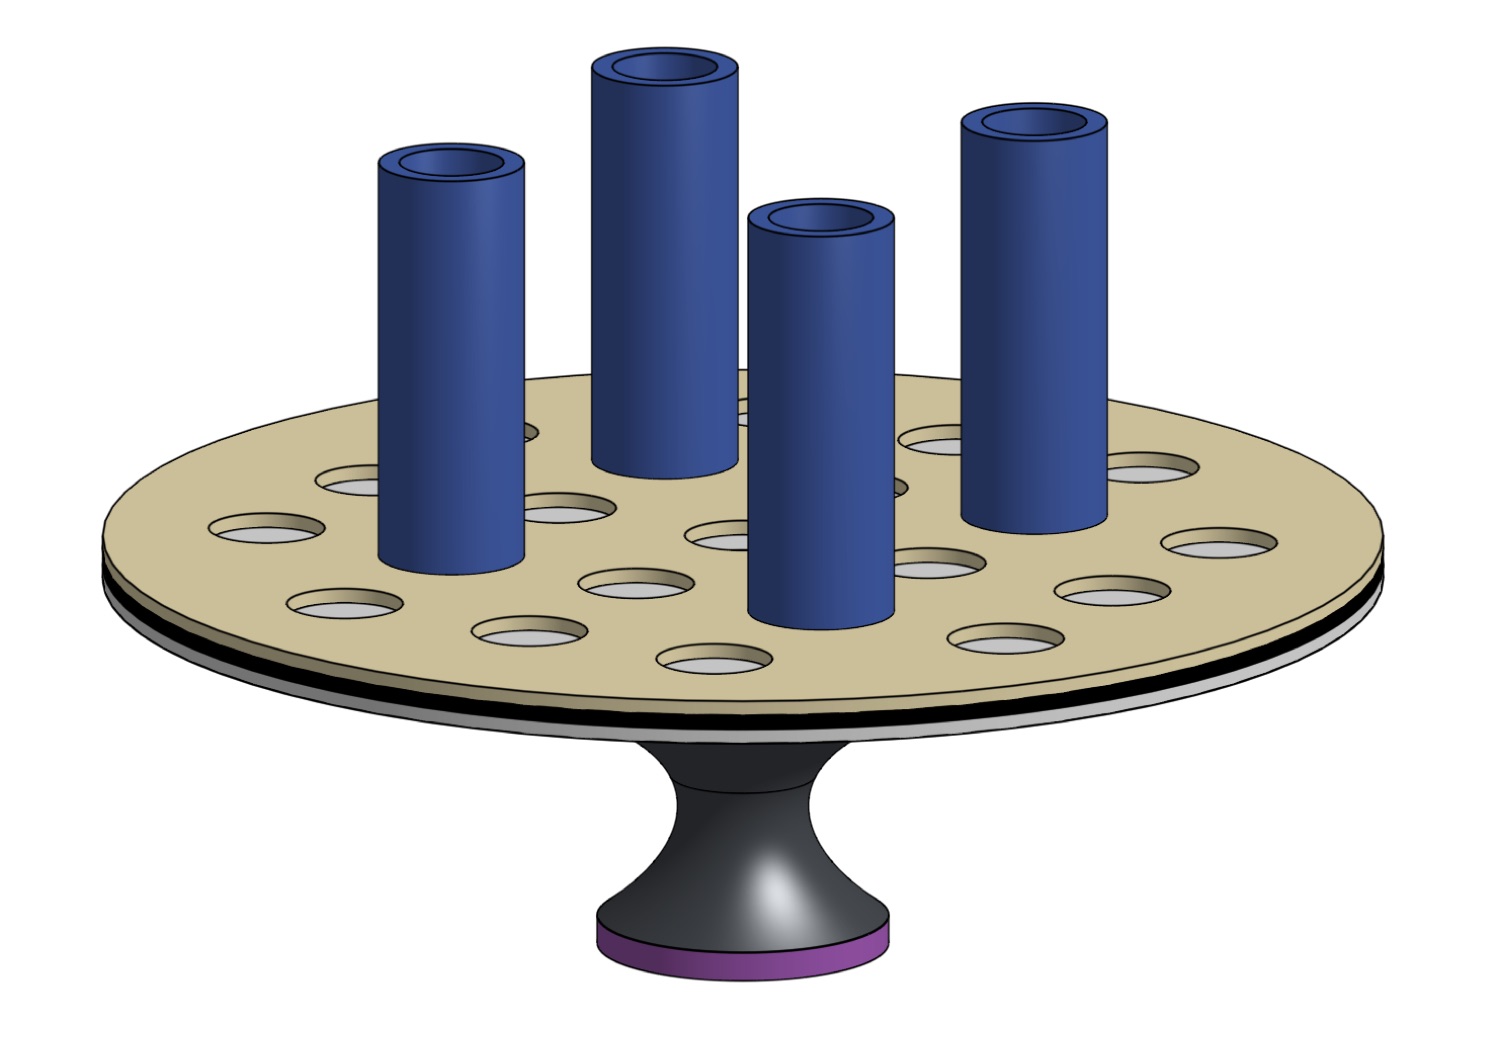
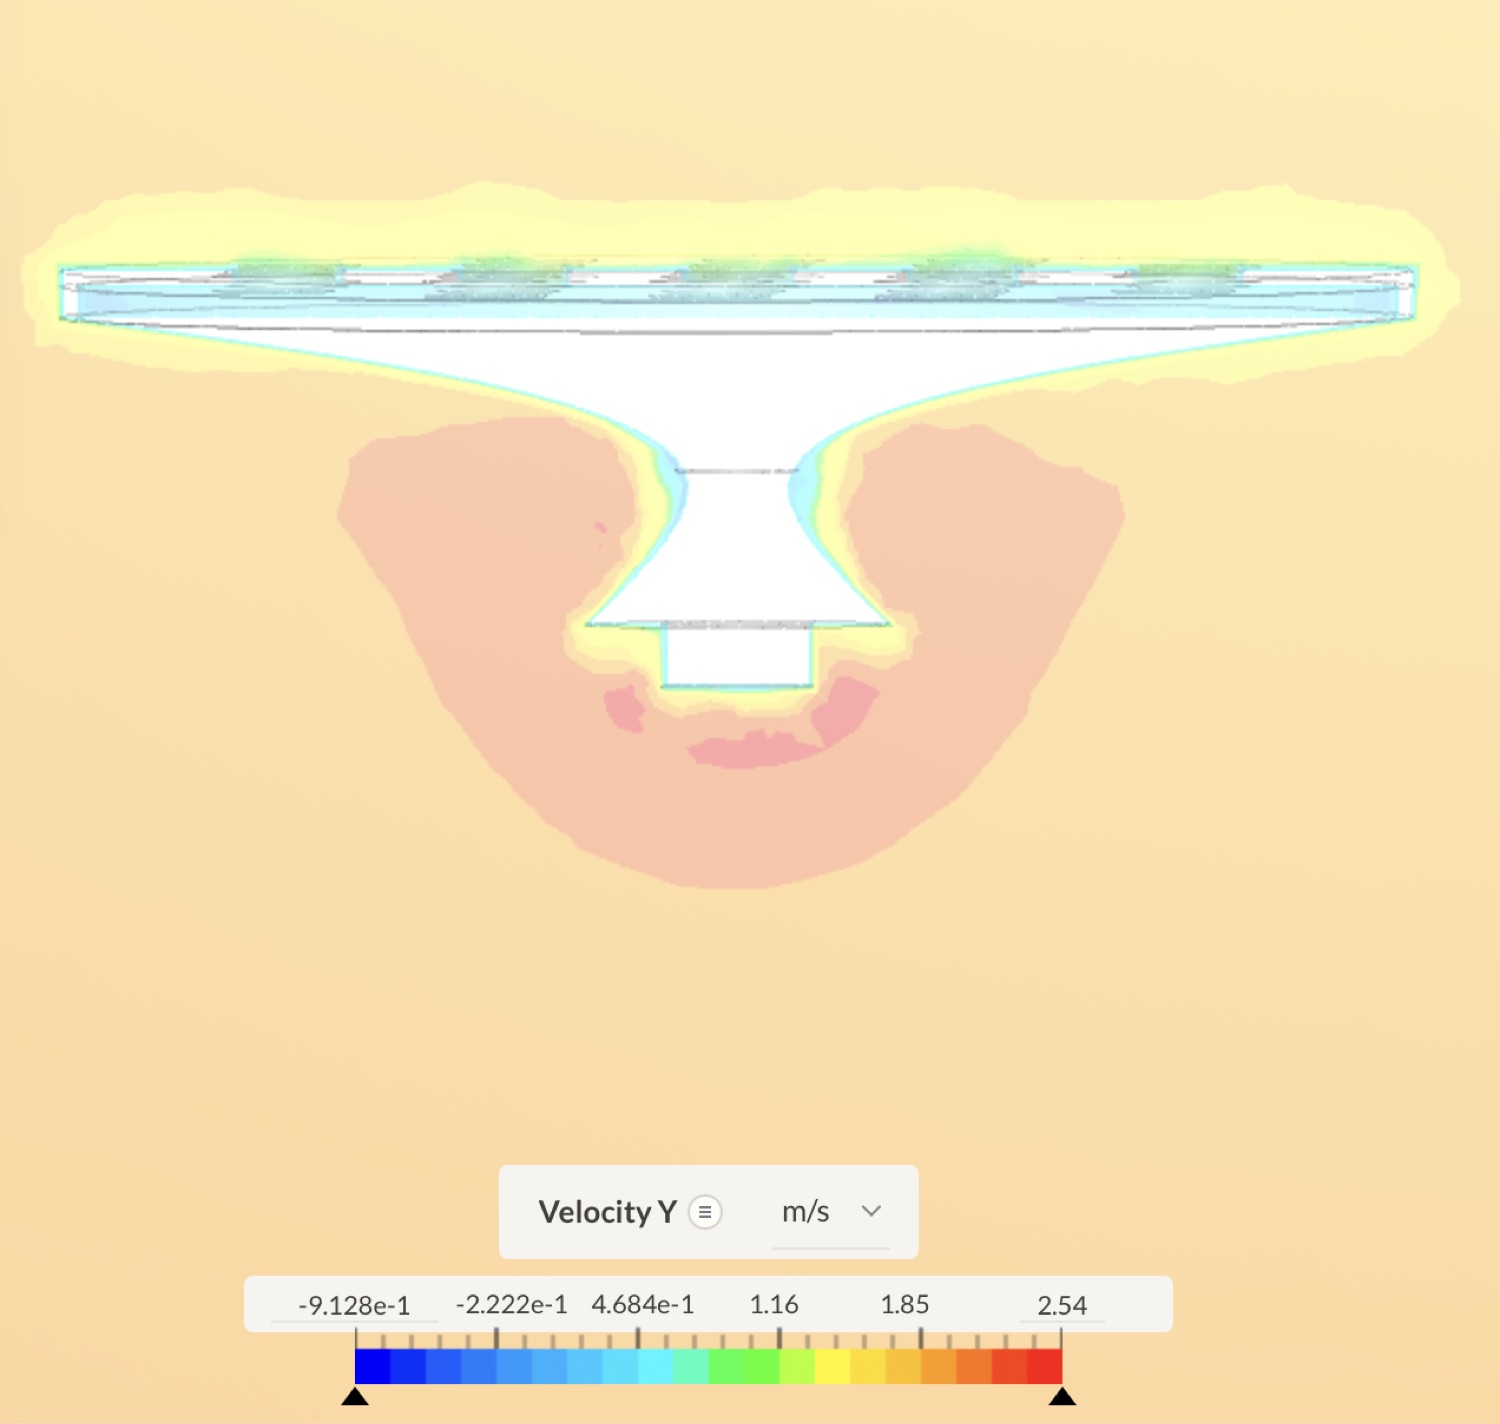
- See how each chimney's plume travels between units in a modular grid.
- Observed problem
- The candles used as a heat source kept going out, and the plume was hard to see when they stayed lit. Shielding, height changes and wind adjustments didn't make the observations reliable. The three-dimensional grid also limited the camera's view.
- Change made
- I proposed replacing the candles with the lab's smoke generator and moving three outlets into one row. A shared chamber feeds them, with an internal baffle meant to spread the generator's concentrated jet.
- What it enabled
- A camera could watch the source and the downstream plume from the side, and the rig produced usable visible and thermal records.
Design the experiment around the measurement you need.
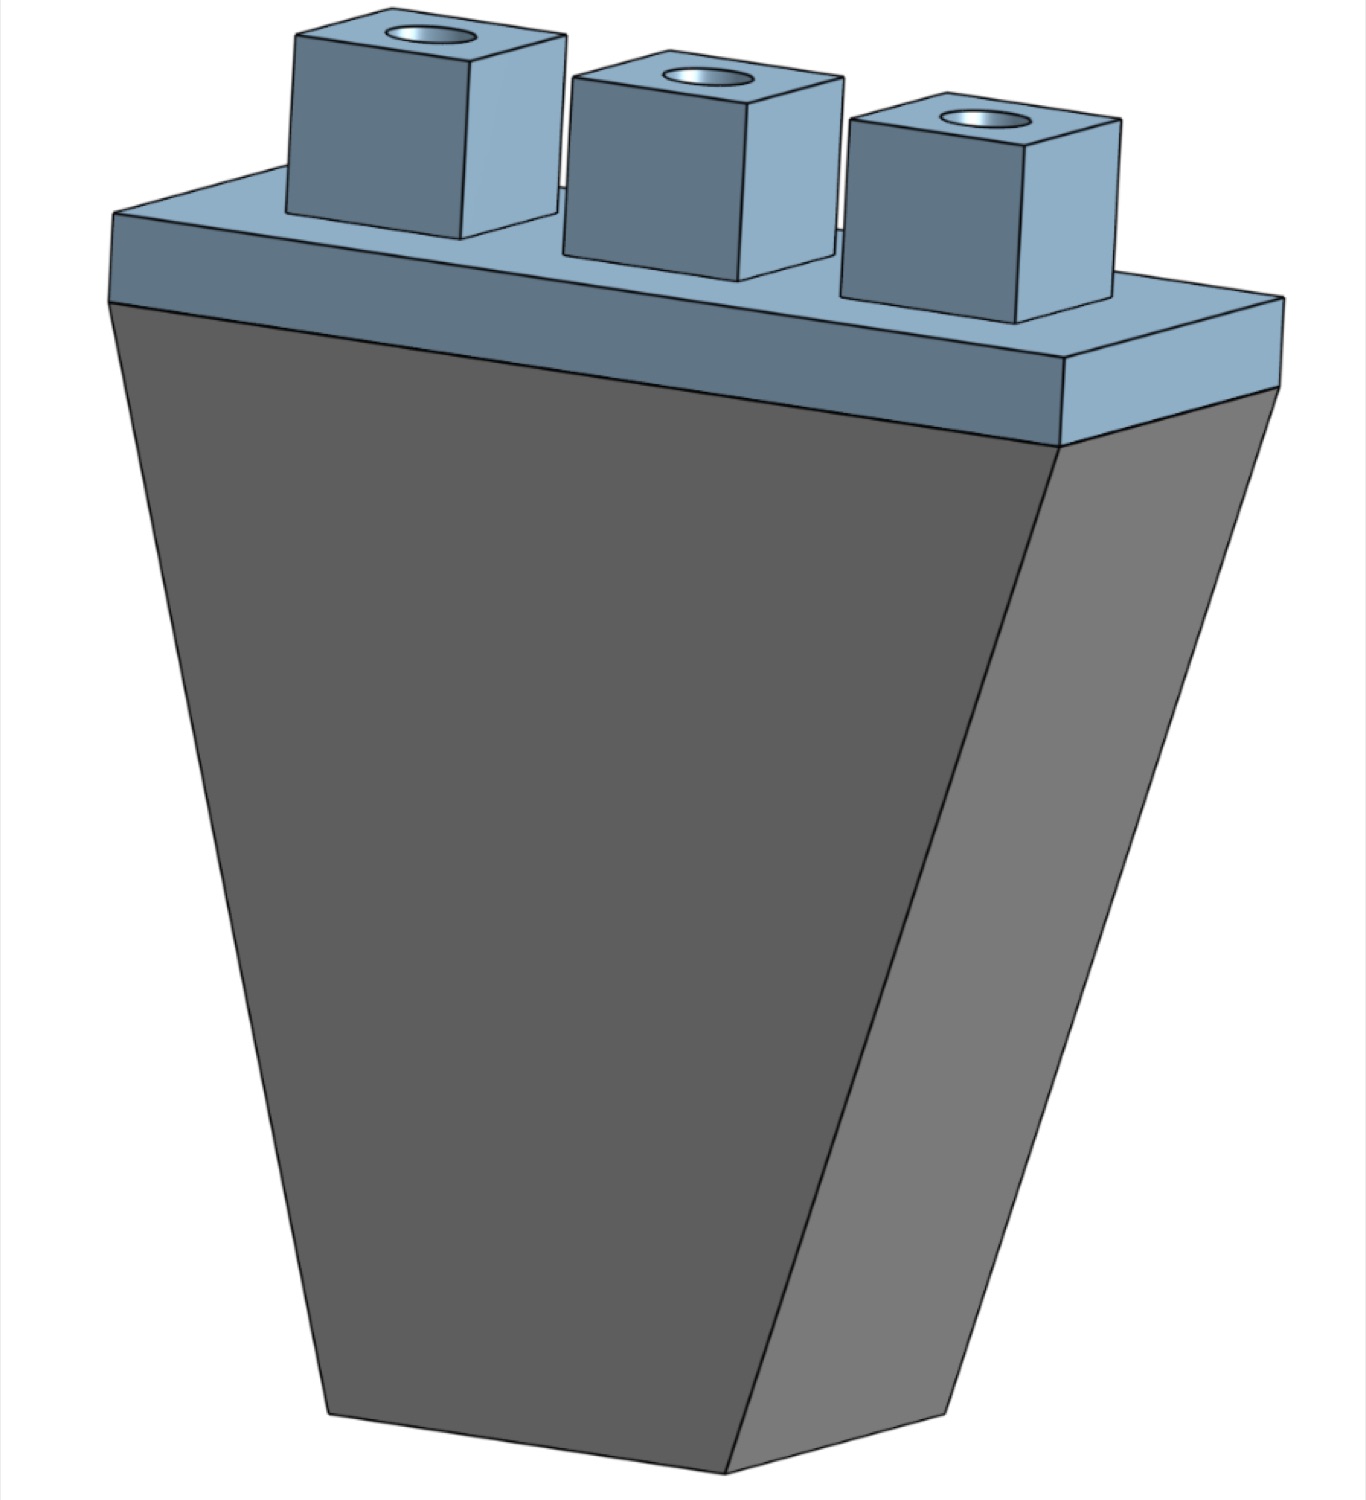
I helped define the revised dimensions, then laser-cut and assembled parts myself. My teammates shared the CAD and fabrication.
Two kinds of evidence
Physical observations from the rig and energy predictions from the model answer different questions, so they're kept apart here.
| Source | Conclusion | Supported by |
|---|---|---|
| Rig observation | More wind made the visible plume more horizontal. | Lower-wind and higher-wind smoke images |
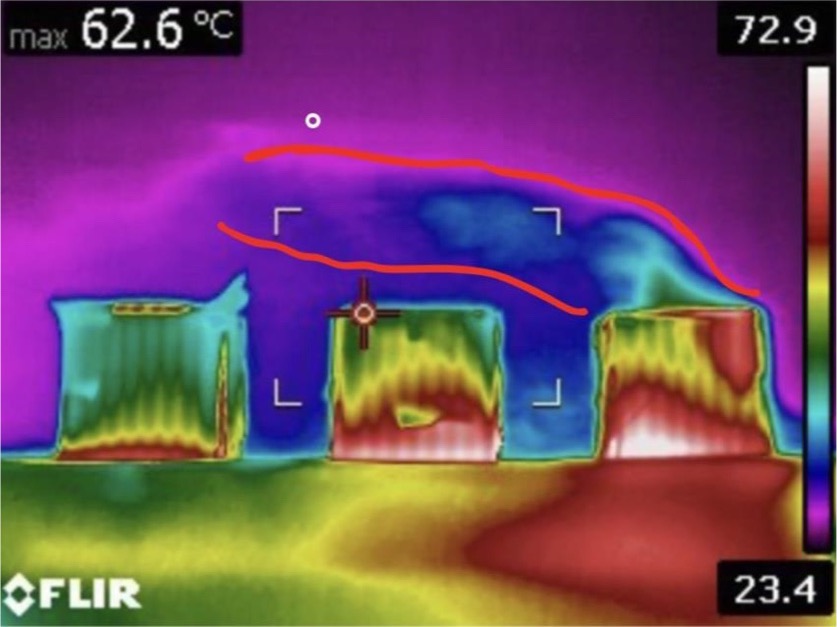
| Rig observation | At high wind with all three outlets running, the downwind units sat in a warm dome and the last unit barely vented. | Smoke and FLIR images |
| Simulation | 14.8% lower simulated energy use in one 24-hour scenario, against all units running. | Dashboard results |
| Simulation | That schedule used only some of the units, so it doesn't show balanced runtime. | Chiller utilization |
What the experiment showed
This section is about plume behavior. The rig is a small smoke and thermal surrogate, and it did not measure chiller energy.
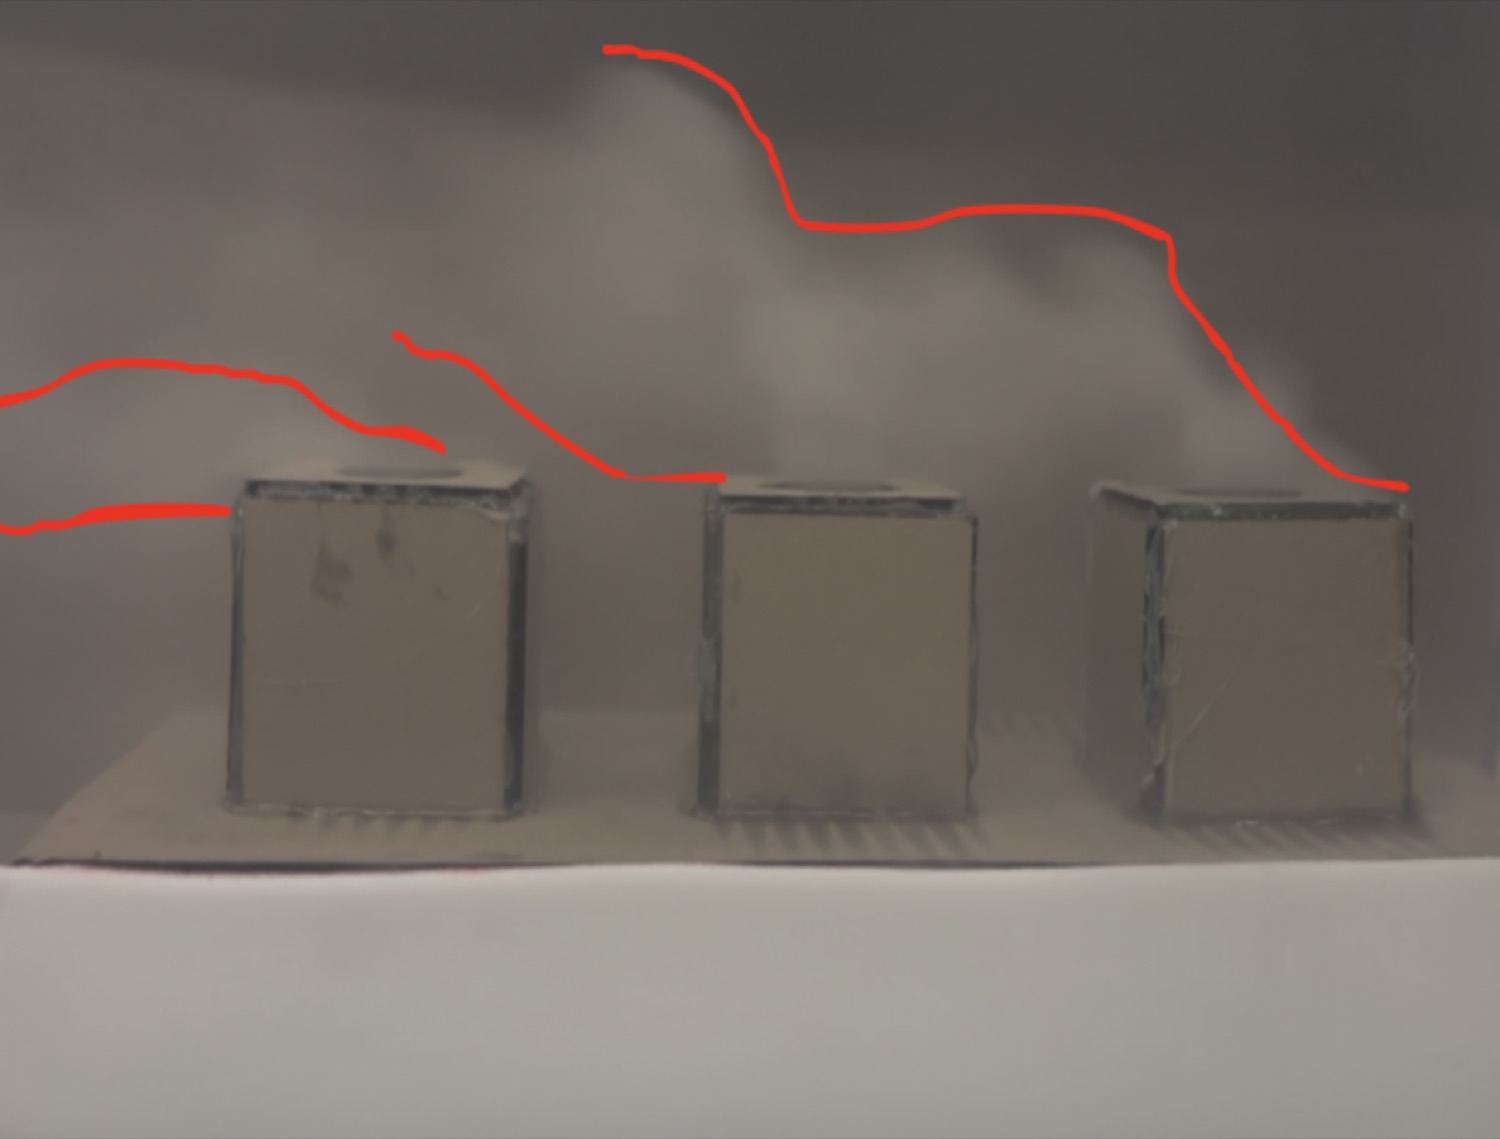
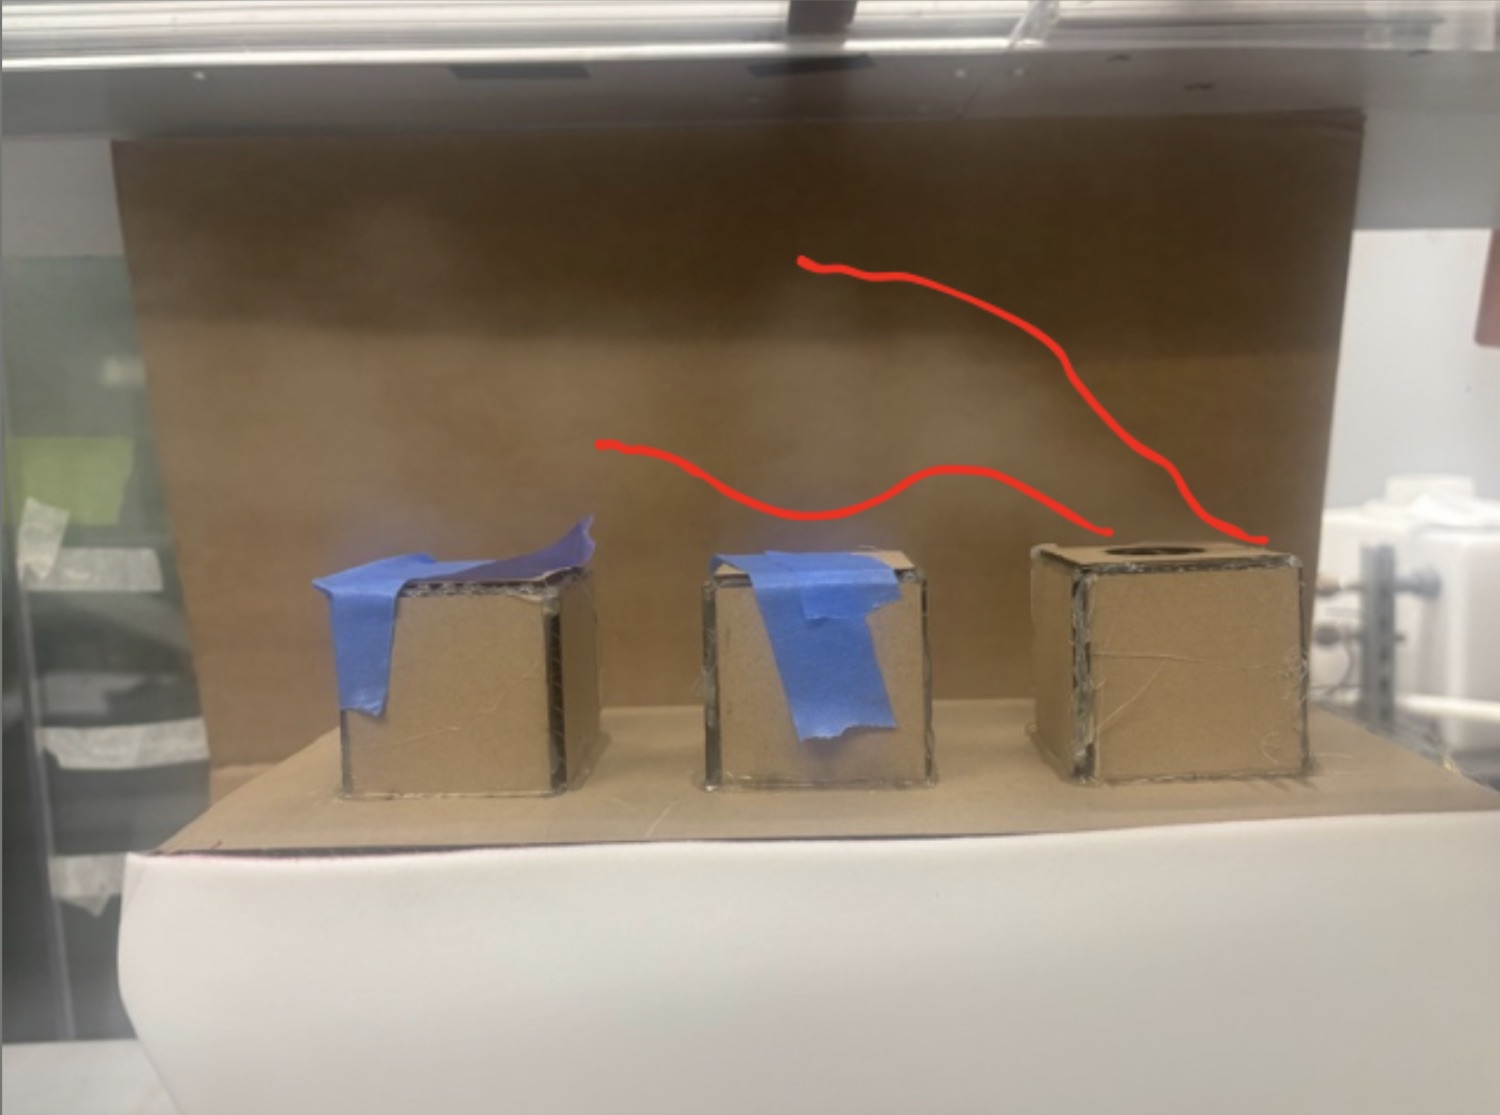
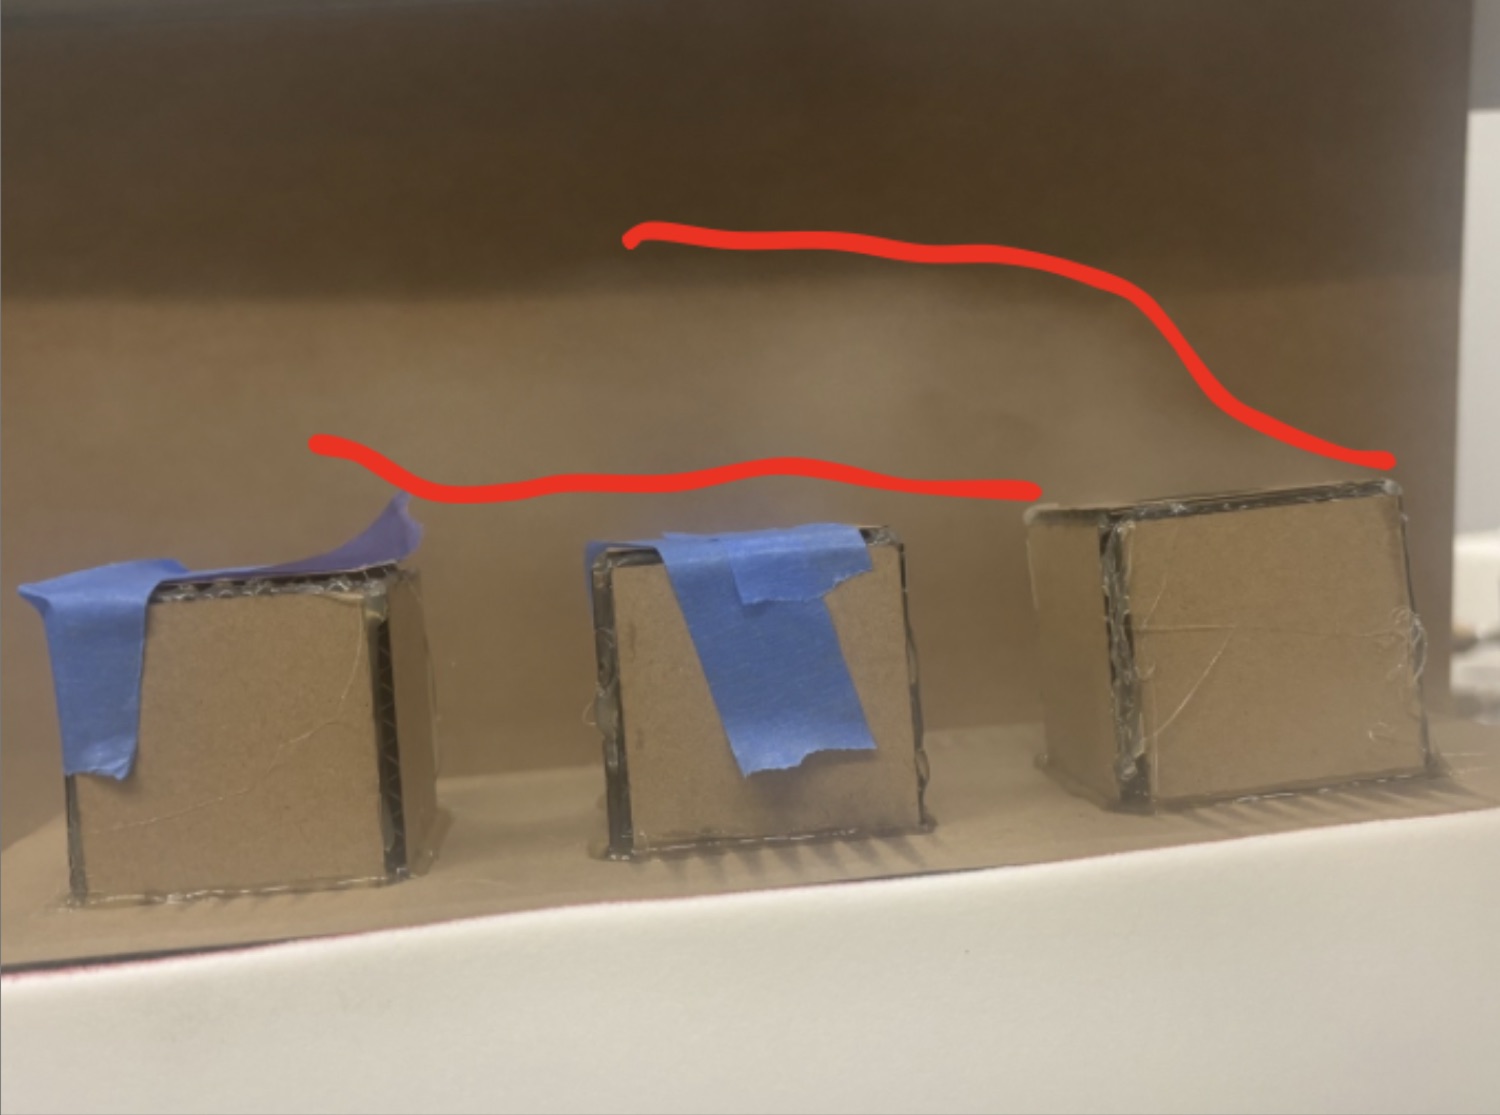
We ran three freestream speeds. More wind made the visible plume more horizontal, which is the behavior that can heat a downwind unit.
At the lowest speed the plume rose above the next unit, so its exhaust may never reach that intake. At the middle speed it leaned back into a dome of warm air over the downwind units, which is the shape our Gaussian model assumes. At the highest speed the dome got flatter and hotter.
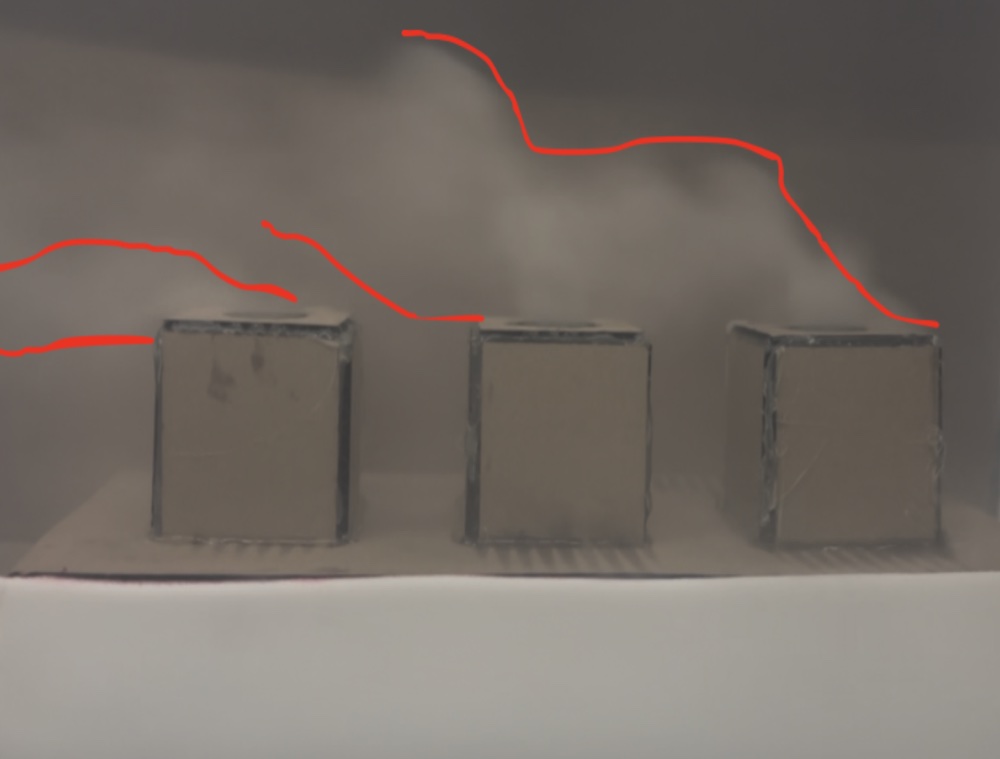
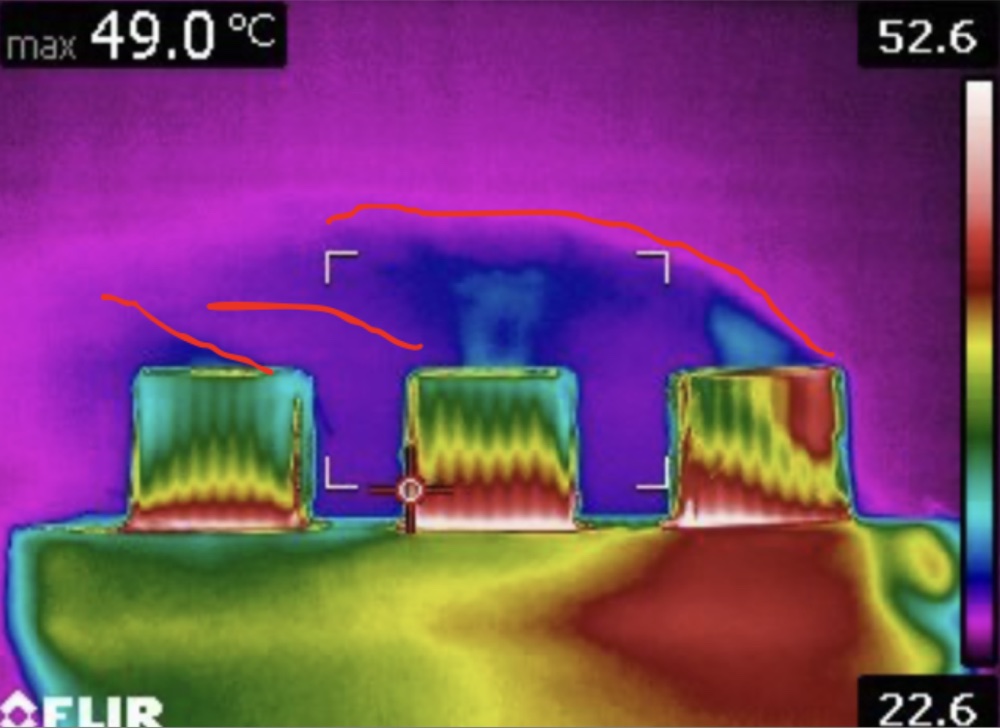
We ran all three outlets at high wind as a worst case, since the exhaust has the least time to rise clear. The last unit barely vented, which we didn't expect. Our explanation, which we did not measure, is that the air slows as it passes each unit, leaving less fast, low-pressure flow to pull exhaust out of the ones downwind.
What the scheduling simulation predicted
This section is a model prediction. The wind-tunnel tests informed the plume model, but they did not validate the energy savings.
How the model works
Wind direction sets how far apart two units are, both downstream and sideways. A Gaussian term then estimates how much of one unit's exhaust reaches another, so a chiller's intake temperature is the ambient temperature plus a contribution from every active unit upwind:
Tin,m = Ta + Σk sk Akm
That intake heating lowers the chiller's coefficient of performance, and the lower COP sets the power it needs:
COPm = COP0,m / (1 + α ΔTm)
P = Σm Qe,m / COPm
A greedy search switches individual units on and off to reduce total power while still meeting the cooling demand.
The model runs behind a browser dashboard, where an operator sets the array, wind, temperature and load and then plays back the schedule. It only makes recommendations and doesn't control any equipment.
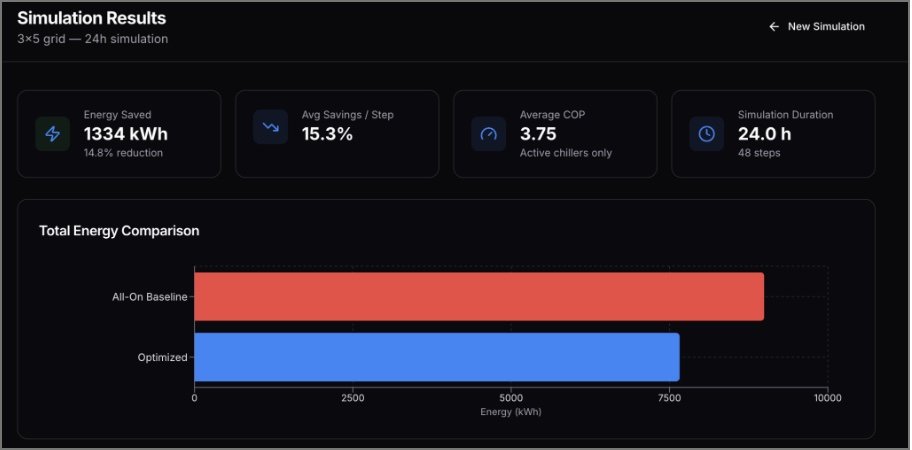
14.8% lower simulated energy use. In one illustrative 24-hour scenario for a 3 × 5 chiller array, compared with running every unit continuously. The energy comparison is a simulation result, not a measured reduction from an operating data center.
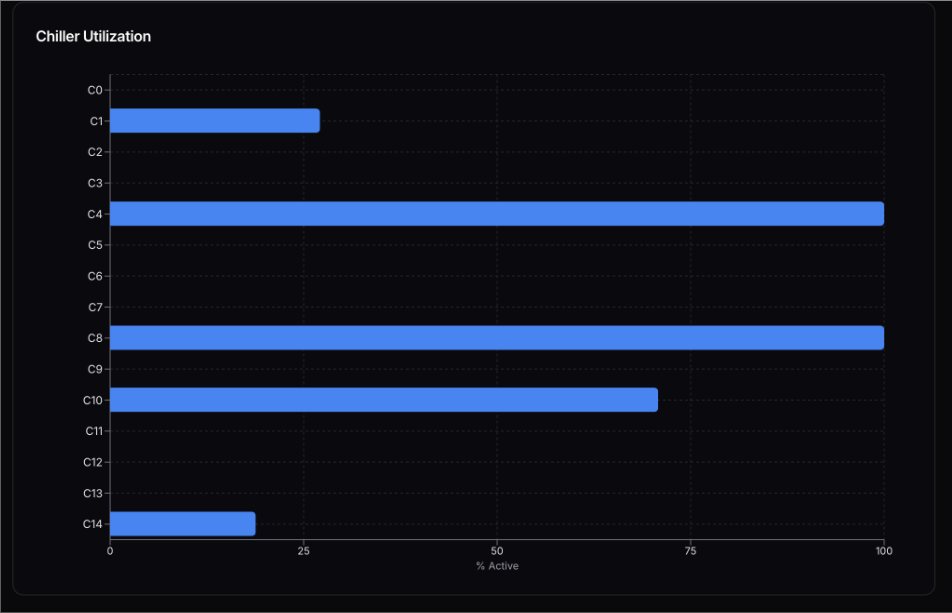
This result demonstrates the method for one scenario. The utilization chart shows that it doesn't meet Trane's runtime-balance goal. The next step would be measuring outlet flow and checking temperatures and COP against independent data.
Report excerpt: apparatus setup and the simulated scenario
“The 2-D model was constructed to simulate three interacting plumes under supervised wind tunnel conditions. There are 3 in-line chimneys that vent the steam of a smoke generator.”
“In the Duke University wind tunnel, only the leading chiller was left unplugged. Steam was injected into the base of the physical model with the smoke generator. The plume shape was analyzed at 3 different wind speeds. A FLIR thermal camera and an iPhone camera were used to capture the plume shape.”
| Scenario item | Value |
|---|---|
| Array | 3 × 5, 10 m spacing |
| Chillers | Base COP 4, 500 kW maximum cooling, α = 0.7, ages from random seed 42 |
| Wind | 5 m/s, rotating ±60° about 90° with a 12 h period |
| Ambient and load | 25 °C; sinusoidal load, 1,200 ± 400 kW, 12 h period |
| Duration | 24 h in 48 steps |
| Reference | All units running |
| Result | 1,334 kWh saved, 14.8% of total energy; average COP 3.75 |
Team
This was a team of four, with Christian Carbeau, Avery Estopinal and Senou Kounouho. Senou, Christian and I worked on scheduling, and Christian led the web interface.